Intro
On Friday evening pve-02 fell off the network. Tailscale couldn’t reach it, corosync lost its links, and from the console the host looked healthy: interface up, link LED blinking, and it could ping its own IP.
Three days earlier, in Part 10 , pve-01’s Realtek NIC had stalled in exactly this way. Same chip in all three hosts, so I went straight for the NIC. I was wrong, and I rebooted a host for nothing before I found out.
TL;DR: The NICs were fine. Their TX and RX counters kept moving, while a ping to the gateway took 5.5 seconds from every host. The cause was the TP-Link AX5400 Wi-Fi router, which is also the only switch in my LAN. A router restart brought the gateway RTT back to 0.5 ms. Check the counters twice and ping the gateway from two hosts before you blame a driver.
The Figure
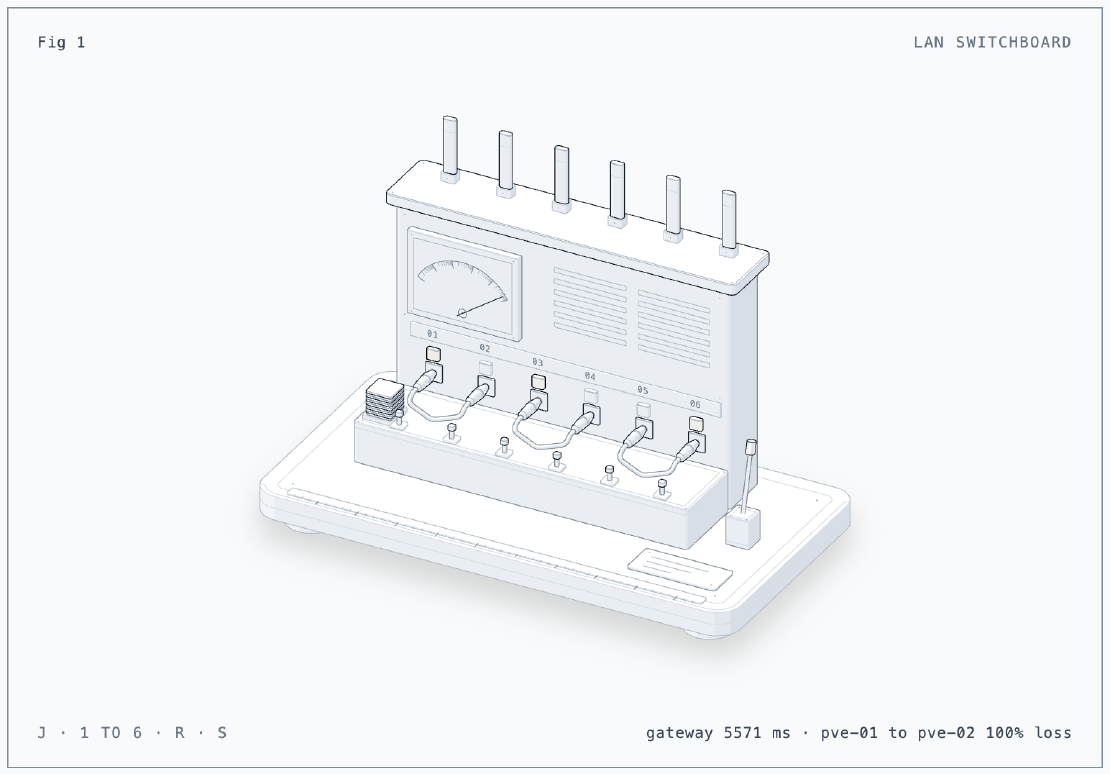
The figure is an operator’s telephone switchboard, because that is what the
router is in my LAN: every call between two lines is patched through it.
Lines 01 to 03 are the Proxmox hosts, 04 is the internet trunk, 05 is Wi-Fi
and 06 is the CCTV camera. The meter on the face reads the gateway RTT on a
log scale, and the tickets on the shelf are calls waiting for an answer.
Press J to jam the board: every lamp blinks fast, the meter climbs to
5571 ms, and the tickets pile up. 1 to 6 unplug a line, which changes
nothing, just like my bisect. R pulls the restart lever, and S adds the
gigabit switch I plan to buy, so the hosts keep talking while the board is
jammed. I generated it with the
anatomy
agent skill.
The Situation
- Three Proxmox VE 9 hosts: pve-01 and pve-02 (Lenovo ThinkCentre Tiny),
pve-03 (an old laptop). All three have a Realtek RTL8168/8111 NIC on the
in-kernel
r8169driver. - Since Part 10, every host runs with EEE off and
pcie_aspm=off. - No separate switch. A TP-Link AX5400 Wi-Fi 6 router is the gateway
(
192.168.101.200), the Wi-Fi access point, and the LAN switch. Its four ports go to pve-01, pve-02, pve-03 and a CCTV camera. - Corosync, Kubernetes and node-to-node Tailscale traffic all cross that router’s built-in switch.
flowchart LR
  NET((Internet)) --- R[TP-Link AX5400<br/>gateway .200<br/>switch + Wi-Fi]
  R --- P1[pve-01]
  R --- P2[pve-02]
  R --- P3[pve-03]
  R --- CAM[CCTV]
  R -.- WIFI[Wi-Fi clients]
Issue 1: It looked like the NIC stall again
Symptom
From the pve-02 console:
vmbr0andenp1s0f0wereUP,LOWER_UP, and the port LED was blinking.ping 192.168.101.202(its own IP) answered. Pings to anything else timed out.ip neighlisted a lot ofSTALEentries.- tailscaled logged
network is unreachableandnetcheck: UDP is blocked, trying HTTPS, and corosync showed both peers' links down.
That matched Part 10 almost line for line, so I checked whether the Part 10 mitigations were actually in place:
grep -o pcie_aspm=off /proc/cmdline
# pcie_aspm=off
ethtool --show-eee enp1s0f0
# EEE status: disabled
journalctl -k -b | grep -iE 'r8169|watchdog|timeout'
# only the normal probe and link up lines, no tx timeout
Dead end: two checks that prove less than they seem
- Pinging your own IP never touches the NIC. The kernel answers it over loopback, so it only proves the IP stack is alive.
- A blinking link LED only means the PHY has a link. In Part 10 the link stayed up while the NIC passed nothing.
Dead end: rebooting pve-02
I rebooted pve-02 from the console at 21:08. It came back with working neighbors, which seemed to confirm the NIC theory. Eight minutes later corosync on pve-02 logged pve-01 going away:
corosync[1269]: [KNET  ] link: host: 1 link: 0 is down
corosync[1269]: [KNET  ] host: host: 1 has no active links
A second host with the same symptom, both already running the Part 10 fix. That made a shared cause much more likely than two NICs failing in the same evening.
Issue 2: The NICs were fine, the LAN was not
Symptom
On the pve-01 console I ran ip -s link show enp1s0f0 twice, a little while apart:
| Counter | First | Second |
|---|---|---|
| RX packets | 4458688 | 4486705 |
| TX packets | 3830449 | 3862741 |
| TX errors | 0 | 0 |
A stalled NIC doesn’t move its TX counter. This one moved by about 32,000 packets. Then the gateway:
ping -c3 192.168.101.200
# 64 bytes from 192.168.101.200: icmp_seq=1 ttl=64 time=5490 ms
# 64 bytes from 192.168.101.200: icmp_seq=2 ttl=64 time=5570 ms
# 64 bytes from 192.168.101.200: icmp_seq=3 ttl=64 time=5654 ms
# rtt min/avg/max/mdev = 5489.797/5571.384/5654.099/67.080 ms
ping -c3 192.168.101.202
# 3 packets transmitted, 0 received, 100% packet loss
No loss to the gateway, but 5.5 seconds per reply on a LAN where it should be well under a millisecond. From pve-02, pve-03 answered in 21 ms. Every path was slow, and every path went through the router.
On the way I also tripped over my own gateway address. I pinged
192.168.101.1 out of habit and got FAILED in ip neigh. ip route says
the gateway is 192.168.101.200, so that entry was meaningless.
Cause
The router’s LAN port LEDs were all blinking fast, and nothing new had been plugged in. I unplugged the hosts one at a time, and every remaining machine and VM still saw multi-second latency. No single wired host was flooding the LAN. The one device left that every packet crossed was the router itself.
I didn’t capture the router’s CPU, uptime or client list before restarting it, so I can’t say whether it simply hung or a Wi-Fi client flooded it. Unplugging wired ports doesn’t rule out a wireless client.
Fix
I restarted the router. Afterwards, from all three hosts:
ping -c3 -q 192.168.101.200
# pve-01: rtt min/avg/max/mdev = 0.419/0.516/0.604/0.075 ms
# pve-02: rtt min/avg/max/mdev = 0.306/0.441/0.572/0.108 ms
# pve-03: rtt min/avg/max/mdev = 0.390/0.483/0.551/0.068 ms
pvecm status | grep -E 'Nodes|Quorate'
# Nodes:            3
# Quorate:          Yes
| Before | After | |
|---|---|---|
| Gateway RTT (avg) | 5571 ms | about 0.5 ms |
| pve-01 to pve-02 | 100% loss | 0% loss |
| Corosync | 2 of 3 nodes | 3 of 3, quorate |
Side effect of the reboot
pve-02 had a one-shot systemd-run timer that would re-enable its morning VM
start at 23:00 if the disk stayed clean (from
Part 21
). Transient timers don’t
survive a reboot, so I had to re-arm it, this time counting disk errors across
both boots with journalctl -k --since.
To do
A dedicated gigabit switch for the three hosts. Today the router is a single point of failure for the cluster’s own traffic, not just for internet access. With the hosts on their own switch and one uplink to the router, a router hang would cost internet access but not corosync quorum or node-to-node traffic. The CCTV camera stays on the router. I plan to buy one next month and will add the result here.
flowchart LR
  NET((Internet)) --- R[TP-Link AX5400]
  R --- CAM[CCTV]
  R -.- WIFI[Wi-Fi clients]
  R --- SW[Gigabit switch]
  SW --- P1[pve-01]
  SW --- P2[pve-02]
  SW --- P3[pve-03]
Next time, look at the router before restarting it. Uptime, CPU and the connected client list would tell a hang apart from a flooding Wi-Fi client.
Lessons
- Check the counters twice before blaming the driver. A stalled NIC freezes its TX counter. A moving counter clears the NIC in ten seconds.
- Ping the gateway from two hosts. Multi-second RTT on several hosts at once is a shared device, not a host problem.
- Pinging your own IP and a blinking LED prove almost nothing. One is loopback, the other is just the PHY.
- Know your real gateway.
ip routefirst, then test the address it shows. - A recent incident biases the diagnosis. The Part 10 stall was fresh, so I matched the symptoms to it and rebooted a host before checking the one thing all hosts share.
Series
This post is part of Homelab Rebuild:
- Part 1: Upgrading Proxmox VE 8 to 9
- Part 2: Starting Over When the IaC Is Broken
- Part 3: When Tailscale Breaks Your Cilium Gateway
- Part 4: Living on the Tailnet
- Part 5: Secrets Without Secrets in Git
- Part 6: Certificates, DNS and a Private CA
- Part 7: Self-Hosted CI and Getting Back to IaC
- Part 8: Stateful Workloads on Unequal Hardware
- Part 9: Going Public Safely with Cloudflare Tunnel
- Part 10: When the Hypervisor Went Quiet
- Part 11: Hardening the Cluster in Five Layers
- Part 12: Observability with Coroot, and Losing pve-01
- Part 13: The Host That Kept Losing Power
- Part 14: Observability, Take Two with OpenTelemetry
- Part 15: Requests and Limits for Everything
- Part 16: Handing the Cluster to FluxCD
- Part 17: Making the Guardrails Earn Their Keep
- Part 18: When the API Server Outgrew Its VM
- Part 19: Logging In to OpenBao with Cloudflare Access and Google
- Part 20: Headlamp SSO, or Teaching kube-apiserver to Trust Cloudflare Access
- Part 21: pve-02 Loses Power, and Pi-hole Has Nowhere to Go
- Part 22: Turning Four Days of Fixes into AI Runbooks
- Part 23: microVM Sandboxes on Proxmox
- Part 24: Pi-hole Without a Home Host
- Part 25: It Was the Router (this post)