Intro
Since Part 14 the cluster has had OpenTelemetry collectors, VictoriaMetrics, VictoriaLogs and Grafana. It worked, in the sense that data went in. It wasn’t useful: the logs dashboard was a wall of noise, there was nothing for Postgres, OpenBao or Flux, and nothing told me when the gateway was down. It went down three times on 2026-10-17 alone, about a minute each, and I only knew because I was watching.
This post covers one evening of fixing that, and the two short outages I caused while doing it.
TL;DR: 90% of all log lines (13.1M of 14.5M a day) came from a
cilium-monitordebug sidecar that the very firstcilium installadded and Flux never removed. An OTel filter processor took the log rate from about 10,000 lines a minute to about 150. New dashboards for CloudNativePG, OpenBao, Flux and the gateway/edge, plus synthetic HTTPS probes and TLS expiry with alerts. Two self-inflicted outages: a corrupt cached image took tailnet DNS down for 3 minutes, and a half-applied TLS switch (server-side apply merged two probe handlers) left Grafana with no data for about 9 minutes.
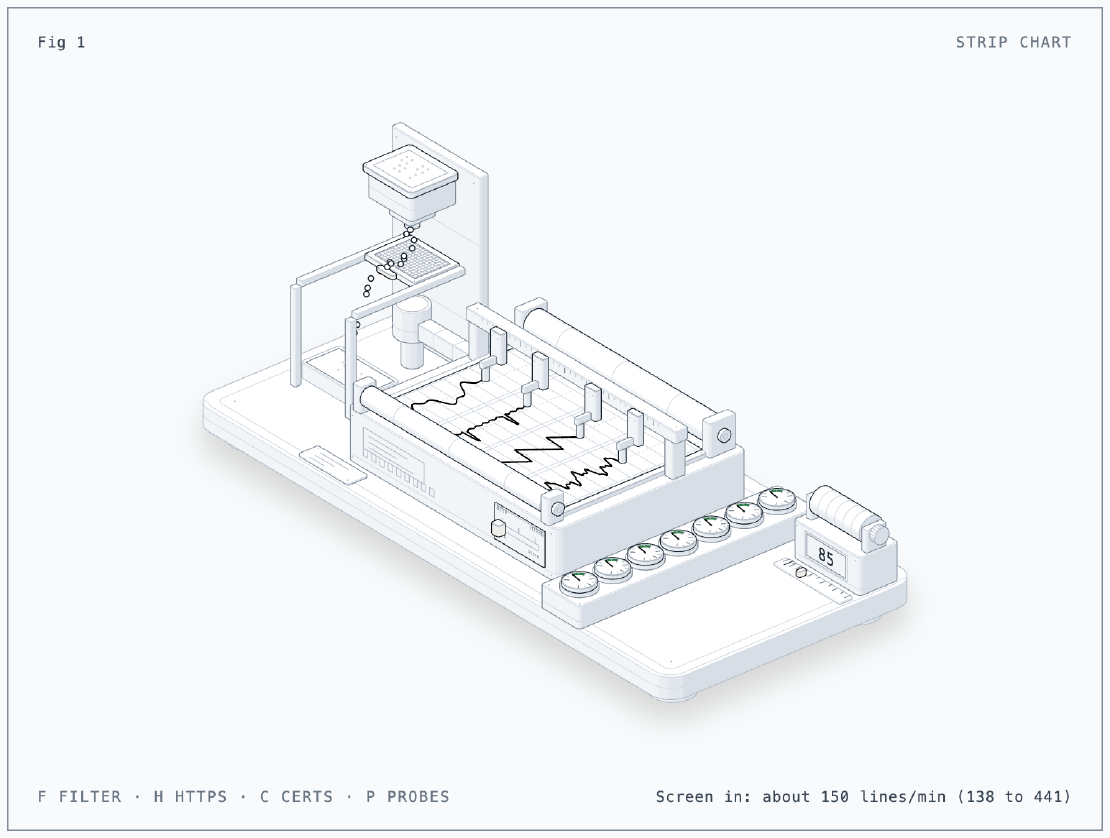
The Figure
The figure is a strip-chart recorder. Log lines enter at the intake on the
left; the mesh screen is the OTel filter, and what it catches drops into the
chaff tray. Each pen is one dashboard (CloudNativePG, OpenBao, Flux, gateway
and edge), the seven round gauges are the HTTPS probes, and the day drum shows
how long the TLS certificates have left. The slider on the front replays the
HTTPS switch from Issue 5: the pens move to HTTPS before the paper feed does,
and the strip runs blank until both match. Press F for the filter, H for
HTTPS, C for the certificates and P for the probes, or click the left,
middle or right of the figure; R resets. Drawn with the anatomy skill
(GitHub: wheresryan22/anatomy).
The Situation
- k0s 1.36.4, 3 controllers and 5 workers on Proxmox (pve-01, pve-02, pve-03), Flux owns everything.
- Cilium 1.20.2 with Gateway API (
lab-gatewayon192.168.101.152), WireGuard between nodes. - OTel collector 0.162.0 (
otelcol-k8simage, chart 0.176.0): a DaemonSet agent for pod logs and kubelet metrics, and one cluster collector for Kubernetes objects and events. - VictoriaMetrics (30 days), VictoriaLogs (14 days), Grafana 13.5.
flowchart LR
  P["pod logs, kubelet"] --> A["OTel agent<br/>(filter/noise)"]
  S["Postgres, Envoy,<br/>cloudflared, cert-manager,<br/>Tailscale"] -->|scrape| C["OTel cluster collector"]
  H["HTTPS probes<br/>every 30 s"] --> C
  A -->|"OTLP over HTTPS"| VM["VictoriaMetrics"]
  A -->|"OTLP over HTTPS"| VL["VictoriaLogs"]
  C --> VM
  C --> VL
  VM --> G["Grafana<br/>dashboards, alerts"]
  VL --> G
Issue 1: 90% of the Logs Were One Sidecar
Symptom
The logs dashboard was unreadable. Counting lines per namespace over 24 hours in VictoriaLogs:
| Namespace | Lines in 24 h |
|---|---|
| kube-system | 14,179,722 |
| arc-runners | 196,065 |
| monitoring | 27,429 |
| everything else | under 15,000 each |
Inside kube-system, per container:
| Container | Lines in 24 h |
|---|---|
cilium-monitor | 13,075,420 |
konnectivity-agent | 1,061,079 |
tetragon | 13,352 |
cilium-agent | 12,397 |
Cause
cilium-monitor is a debug sidecar that runs cilium-dbg monitor and prints
every network flow:
-> endpoint 229 flow 0x199bb245 , identity host->36320 state established ifindex lxccb82d9cb725f orig-ip 10.0.1.199
My Helm values never turn it on, and the chart default is
monitor.enabled: false. The live DaemonSet still had it. Its
managedFields owner was cilium, last updated 2026-10-12T11:10:03Z: the
very first cilium install, before Flux took over. Flux upgrades with
server-side apply, which never removes a field the chart simply stops
rendering, because the field belongs to a different field manager. It’s the
same trap as the stale enable-ingress-controller key in
Part 26
, this time a whole
container.
konnectivity-agent was the other 7%: k0s ships it logging a line per tunneled
packet ("received DATA", "write to remote", "Determined server count").
Fix
Two parts. First, drop the noise at the agent, so it never reaches VictoriaLogs whatever runs in the cluster:
processors:
  filter/noise:
    error_mode: ignore
    logs:
      log_record:
        - 'resource.attributes["k8s.container.name"] == "cilium-monitor"'
        - 'resource.attributes["k8s.container.name"] == "konnectivity-agent" and IsMatch(body, "(received DATA|write to remote|Determined server count)")'
Lines per minute, all namespaces:
| Minute (UTC) | cilium-monitor | All logs |
|---|---|---|
| 15:07 | 9,507 | 10,181 |
| 15:09 | 0 | 441 |
| 15:10 | 0 | 138 |
Second, remove the sidecar itself, by hand, once:
kubectl -n kube-system patch ds cilium --type=json \
  -p '[{"op":"remove","path":"/spec/template/spec/containers/1"}]'
Patching the DaemonSet restarts every cilium agent, and every agent restart
takes lab-gateway down until Envoy gets its listeners back: 51 seconds this
time (22:12:02 to 22:12:53 WIB).
Issue 2: Dashboards That Answer Questions
Postgres
CloudNativePG exposes metrics on a port named metrics (9187), but nothing
scraped it. The cluster collector now does, with Kubernetes service discovery,
and keeps the instance role as a label:
receivers:
  prometheus/apps:
    config:
      scrape_configs:
        - job_name: cnpg
          kubernetes_sd_configs:
            - role: pod
              namespaces: {names: [databases]}
          relabel_configs:
            - source_labels: [__meta_kubernetes_pod_container_port_name]
              regex: metrics
              action: keep
            - source_labels: [__meta_kubernetes_pod_label_cnpg_io_instanceRole]
              target_label: role
The dashboard shows instances up, streaming replicas, replication lag, which instance is primary (a flip means a failover), transactions per second, connections, database size, cache hit ratio and WAL. Two surprises on the way:
- Counter names change. VictoriaMetrics runs with
opentelemetry.usePrometheusNaming, so counters get_total(cnpg_pg_stat_database_xact_commit_total) and units become suffixes (httpcheck_duration_milliseconds). My first dashboard used the exporter’s names and showed nothing for TPS. Check names in the database, not in the exporter. - Postgres logs are JSON. A regex for
errormatches the"error_severity"key on every line. Matching the value instead,"error_severity":"(WARNING|ERROR|FATAL|PANIC)", found 4,153 warning and error lines in 48 hours that I hadn’t seen. Also: inside a LogsQL quoted string,\bis a backspace, not a regex word boundary.
OpenBao and Flux
OpenBao has no metrics scrape yet, so its dashboard uses logs and kubelet
metrics: pods ready, restarts, logins by method (counted from lease
revocations: kubernetes is External Secrets, oidc is me), seal and Raft
lines, permission denied. Flux’s dashboard reads Kubernetes events from
VictoriaLogs: Warning events per kind, a failures table and the applied
revisions. Events have no _msg field there, so the panels select
object.reason, object.note and object.regarding.* directly.
Issue 3: Watching the Gateway and the Edge
Probes
The OTel httpcheck receiver probes every 30 seconds: the apps behind
lab-gateway (with the lab CA verified), the OpenBao API and the three
Proxmox UIs. One catch: pods can’t resolve *.franzramadhan.lab, because
CoreDNS forwards to the node’s resolver, not Pi-hole. Instead of editing the
k0s-managed CoreDNS, the collector pod gets hostAliases pointing the probed
names at .152.
For the “down” alert, I checked the receiver source first: it records
httpcheck.duration before it checks for a request error, so a dead endpoint
still produces a duration sample. “Probed, but no 2xx for 2 minutes” is then a
reliable down signal:
count by (http_url)(max_over_time(httpcheck_duration_milliseconds[2m]))
  unless on(http_url)
(max by (http_url)(max_over_time(httpcheck_status_ratio{http_status_class="2xx"}[2m])) == 1)
A test with the class flipped to 5xx fired for all 7 URLs.
Envoy, cloudflared and Tailscale
The same Prometheus receiver scrapes cilium-envoy (envoy-metrics, 9964) for
requests, 5xx and p95 latency per gateway backend, cloudflared (2000) for its
4 HA connections per pod, and the Tailscale proxies after enabling
metrics.enable in the default ProxyClass.
TLS expiry
Two sources, because they answer different questions: cert-manager’s
certmanager_certificate_expiration_timestamp_seconds (every Certificate it
manages) and the receiver’s httpcheck.tls.cert_remaining (the certificate
each endpoint actually serves, including the Proxmox UIs cert-manager doesn’t
manage). Days left at 22:25 WIB:
| Certificate | Days left |
|---|---|
*.franzramadhan.lab, *.franzramadhan.dev, openbao-tls | 84.9 |
pg-server | 89.4 |
| Proxmox UIs (pve-01, pve-02, pve-03) | 219 to 248 |
| lab root CA | 3,644.9 |
cert-manager renews at 30 days, so the alert fires below 14: at that point renewal has been failing for two weeks.
Issue 4: A Metrics Toggle Took Tailnet DNS Down
Symptom
Enabling ProxyClass metrics restarts the Tailscale proxies. The one serving
tailnet DNS came back as Init:Error:
# kubectl -n tailscale logs ts-pihole-dns-tailscale-...-0 -c sysctler
exec /bin/sh: exec format error
Cause
The image (tailscale/tailscale:v1.102.4) was “already present on machine” on
k0s-pve-01-worker-1, and the same image ran fine on both pve-02 workers. A
binary that suddenly has the wrong format on one node is a corrupt cached
image, not a bad release.
Fix
k0s crictl rmi docker.io/tailscale/tailscale:v1.102.4   # on the worker
kubectl -n tailscale delete pod ts-pihole-dns-tailscale-...-0
The pod came back on another worker and tailnet DNS answered 10 of 10 queries.
About 3 minutes down (15:21 to 15:24 UTC); tailnet devices fell back to
1.1.1.3 meanwhile.
Issue 5: The TLS Switch That Applied Halfway
Symptom
VictoriaMetrics and VictoriaLogs served plain HTTP inside the cluster.
WireGuard already encrypts node to node, but I wanted HTTPS end to end. One PR
added a lab-CA Certificate, turned on --tls for both, and switched the two
collectors and Grafana’s data sources to https with the CA. After the
merge, every Grafana panel said No data.
Cause
Grafana and the collectors upgraded. The two databases didn’t:
StatefulSet.apps "vmsingle" is invalid:
spec.template.spec.containers[0].readinessProbe.tcpSocket:
Forbidden: may not specify more than 1 handler type
With TLS on, the VictoriaMetrics chart switches the readiness probe from
httpGet to tcpSocket. Server-side apply merges the new manifest into the
live object field by field, so it kept the live httpGet and added
tcpSocket, and the API rejects a probe with two handlers. So the clients
spoke HTTPS to servers still on HTTP.
sequenceDiagram
  participant Flux
  participant G as Grafana and collectors
  participant V as VictoriaMetrics/Logs
  Flux->>G: upgrade: use https
  G-->>Flux: ok
  Flux->>V: upgrade: --tls, tcpSocket probe
  V-->>Flux: rejected (httpGet + tcpSocket)
  G->>V: HTTPS to an HTTP server
  V-->>G: fails: "No data"
Fix
One upgrade with a client-side three-way merge, which deletes httpGet
because the previous release manifest had it:
spec:
  upgrade:
    serverSideApply: disabled   # one-off, reverted in the next PR
Both StatefulSets rolled, Grafana’s data sources reported OK over HTTPS, and VictoriaLogs took 9,472 lines in the first minute as the collectors flushed their queues. The gap was about 9 minutes (15:32 to 15:41 UTC); data older than the exporters’ retry window is gone.
Lessons
- Look at log volume per container before building log dashboards. One forgotten sidecar was 90% of everything.
- Fields from an old installer survive Flux forever. Server-side apply won’t delete what another field manager owns: a ConfigMap key in Part 26, a whole container here.
- A chart change that swaps a field’s type breaks server-side apply. Render it, expect the merge to fail, and plan the one-off client-side upgrade in the same change. Upgrade servers before clients, and check every HelmRelease after a merge, not just the first one.
- Check metric names where they’re stored. The translation to Prometheus naming changed them, and the dashboard silently showed nothing.
- A harmless toggle is still a restart. Enabling metrics restarted a DNS proxy, and the restart found a corrupt image cache.
Series
- Part 1: Upgrading Proxmox VE 8 to 9
- Part 2: Starting Over When the IaC Is Broken
- Part 3: When Tailscale Breaks Your Cilium Gateway
- Part 4: Living on the Tailnet
- Part 5: Secrets Without Secrets in Git
- Part 6: Certificates, DNS and a Private CA
- Part 7: Self-Hosted CI and Getting Back to IaC
- Part 8: Stateful Workloads on Unequal Hardware
- Part 9: Going Public Safely with Cloudflare Tunnel
- Part 10: When the Hypervisor Went Quiet
- Part 11: Hardening the Cluster in Five Layers
- Part 12: Observability with Coroot, and Losing pve-01
- Part 13: The Host That Kept Losing Power
- Part 14: Observability, Take Two with OpenTelemetry
- Part 15: Requests and Limits for Everything
- Part 16: Handing the Cluster to FluxCD
- Part 17: Making the Guardrails Earn Their Keep
- Part 18: When the API Server Outgrew Its VM
- Part 19: Logging In to OpenBao with Cloudflare Access and Google
- Part 20: Headlamp SSO, or Teaching kube-apiserver to Trust Cloudflare Access
- Part 21: pve-02 Loses Power, and Pi-hole Has Nowhere to Go
- Part 22: Turning Four Days of Fixes into AI Runbooks
- Part 23: microVM Sandboxes on Proxmox
- Part 24: Pi-hole Without a Home Host
- Part 25: It Was the Router
- Part 26: TLS on the Front, Plaintext Behind It
- Part 27: One Bad Power Adapter, Two Different Deaths
- Part 28: Observability, Take Three: Making It Worth Looking At (this post)