Intro
Part 28 made the dashboards worth looking at. This post is about the other half: being told when something breaks, without looking.
There were 14 Grafana alert rules: nodes, containers, workloads, disks, Tetragon, the gateway probes, certificates, the tunnel and Tailscale. Every one of them reported “OK” when it got no data. So the most useful alert of all could never fire: if the collector, VictoriaMetrics or the whole cluster died, the rules went quiet, and quiet looked like healthy.
TL;DR: The lab’s Grafana went from 14 to 37 rules (Postgres, Flux and secret sync, LiteLLM, OpenBao, Pi-hole DNS, the control plane and the monitoring pipelines themselves). An always-firing Watchdog pings healthchecks.io every two minutes, so a dead lab is reported from outside. Alerts go to Telegram as well as email. Grafana Cloud watches the Proxmox hosts with 14 more rules, including SMART health. On the way, a metrics bug made LiteLLM’s counts wrong, Grafana Cloud’s routing had been dropping every built-in host alert, and my own SMART query broke.
The Figure
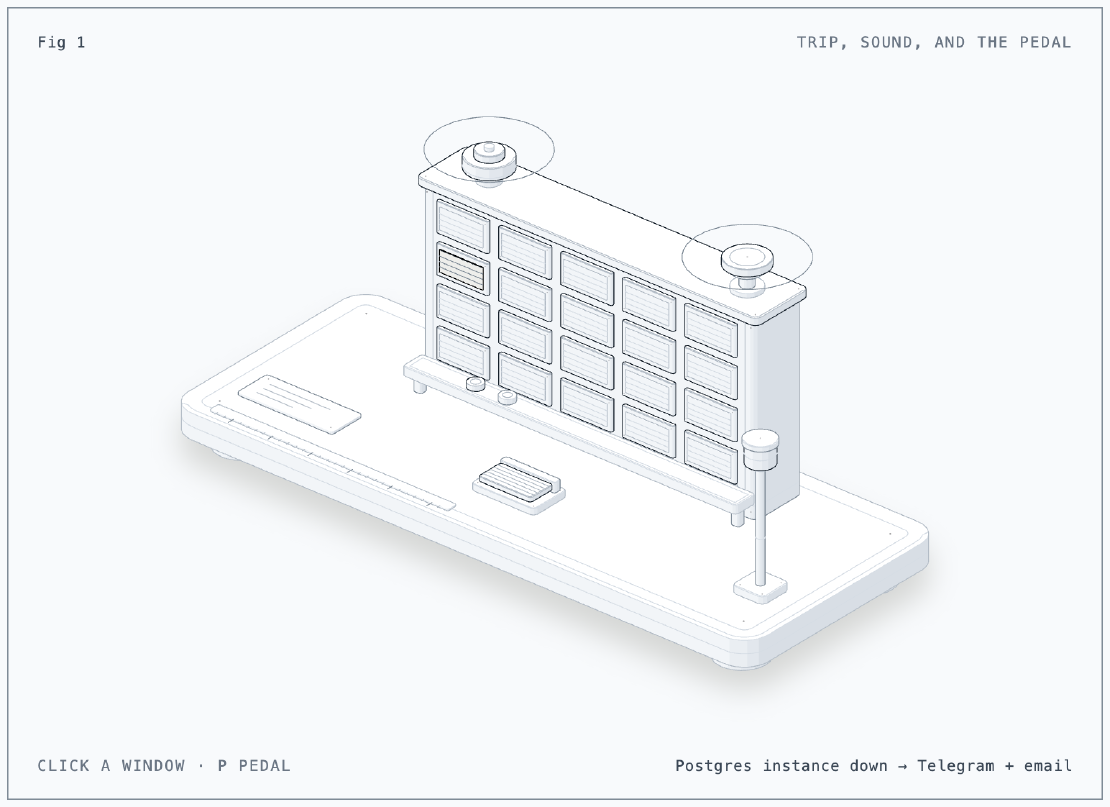
The figure is an annunciator panel, the wall of labelled lamp windows found in control rooms. Each window is an alert rule; when one trips, it lights, the horn sounds (Telegram) and the bell rings (email). The pedal at the front is a dead-man’s switch: the panel has to press it every two minutes to show it is still alive, and when the presses stop, a lamp outside the room lights instead. Click a window to trip that rule, or press P to stop the pedal and watch the outside lamp catch it. I built it with the anatomy skill (see References).
The Situation
What the 14 rules could not see:
| Gap | Why |
|---|---|
| Postgres instances | CNPG runs plain pods, not a StatefulSet, so “StatefulSet degraded” never matched them |
| A dead metrics or logs pipeline | noDataState: OK on every rule: no data was silence |
| Flux and ExternalSecret failures | no metrics for them, only Kubernetes events |
| LiteLLM errors and spend | new since Part 29 |
| Pi-hole DNS answers | the probes only checked the web UI |
| OpenBao sealed or without a leader | no OpenBao metrics at all |
| kube-apiserver and etcd | host processes on the controllers, not pods |
| The whole lab | nobody watches the watcher |
Setup
More rules in the lab
All rules are files in git (alerts/alerting.yaml), loaded by Grafana’s
alerting sidecar. The new ones, by group:
| Group | Rules |
|---|---|
| Apps | LiteLLM request errors (log lines), spend over $2 a day or $40 a month; Postgres instances, streaming replica, backup age, backup failed, WAL archiving stuck; scrape target down; pods stuck Pending; Pi-hole DNS failing; OpenBao sealed or down, Raft unhealthy |
| Pipelines | metrics pipeline silent, logs pipeline silent |
| GitOps | Flux release or Job failed, Flux source or secret sync failing (both from Kubernetes events in VictoriaLogs) |
| Control plane | kube-apiserver down, 5xx errors, etcd requests slow, apiserver memory, etcd database size |
Three of them needed something new to watch:
- Pi-hole: the OTel collector has no DNS check, so a small busybox
Deployment asks the LAN DNS address for a local record and an external
name every 30 seconds and logs
result=okorresult=fail. The alert counts the failures in VictoriaLogs. - OpenBao: its listener now serves
/v1/sys/metricswithout a token. A sealed pod answers 503, so “fewer than 3 pods scraped” means sealed or down. The metric names still start withvault_. - Control plane: the collector scrapes
/metricson each controller’s apiserver with its ServiceAccount token, keeping six metric families out of about 64,000 lines per scrape.
Every query was run against live data before it went in, and each new baseline is written in the rule’s description: etcd requests take 4 to 5 ms, the apiserver uses 1.25 to 1.48 GiB, and the etcd database is 195 MiB.
A heartbeat from outside
The Watchdog rule is vector(1): it always fires. Its only route sends
it to a webhook that pings a healthchecks.io
check. The check expects a ping every five minutes from 06:00 to 23:00 WIB
(the lab is off at night) with 20 minutes of grace. If the pings stop because
the cluster, Grafana or VictoriaMetrics died, healthchecks.io sends the email.
flowchart LR
  W["Watchdog rule<br/>always firing"] -->|"webhook, every 1-2 min"| HC["healthchecks.io"]
  HC -->|"no ping for 20 min"| M["email"]
  R["every other rule"] --> T["Telegram"]
  R --> E["email"]
The ping URL is a secret of sorts, so it lives in OpenBao. External Secrets renders the whole contact point file from it, and Grafana’s sidecar reads Secrets as well as ConfigMaps, so the URL never touches git. The Telegram bot token works the same way.
Grafana Cloud for the hosts
The Proxmox hosts already send metrics and logs to Grafana Cloud through Alloy (Part 12), and alerts there keep working when the cluster is down. It had three host rules. It now has 14, plus the Linux integration’s 24 built-in ones:
- Pi-hole from the LAN side: a timer on pve-03 queries the DNS address every minute, the way a laptop on the LAN would. The in-cluster probe goes through Cilium’s socket load balancer and would miss a broken L2 announcement; this one doesn’t.
- SMART: there is no SMART exporter package for these hosts, so a short
Python script runs
smartctl --jsonevery 10 minutes and writes the values as Prometheus text for Alloy’s built-in textfile collector. Rules: disk failing, bad sectors or CRC errors growing, NVMe wear, disk temperature, and SMART data gone stale. - Network: NIC link down or below 1000 Mbit/s, and the r8169 “transmit queue timed out” kernel line from the Part 10 stall.
- Root disk, CPU temperature and Proxmox storage (a full LVM thin pool corrupts VM writes).
Issue 1: LiteLLM’s metrics made a series per request
Symptom
While writing the LiteLLM rules I looked at one of its OTel metrics:
gen_ai_client_operation_duration_seconds_count{
  gen_ai_request_model="@cf/cloudflare/clef",
  hidden_params="{\"model_id\": ..., \"response_cost\": 6.07e-05, ...}",
  metadata_requester_metadata="{\"trace_id\": \"8513c1ad...\", ...}",
  metadata_requester_ip_address="127.0.0.1", ...}
The response cost, the trace ID and the client IP were labels. Every request created new series.
First fix, which made the numbers wrong
The collector’s attributes processor deleted those three labels. The series count dropped, and so did the counts: after three requests to one model, the request count read 1. LiteLLM keeps one cumulative stream per label set. With the labels gone, three streams landed on one series, and VictoriaMetrics kept one of them. The spend alert would have under-counted.
Fix
Delete the labels, then add up the streams that now share a label set, with the transform processor:
transform/litellm:
  metric_statements:
    - context: datapoint
      conditions: ['resource.attributes["service.name"] == "litellm"']
      statements:
        - delete_matching_keys(attributes, "^(hidden_params|metadata[._](requester_metadata|requester_ip_address|applied_guardrails))$")
    - context: metric
      conditions: ['resource.attributes["service.name"] == "litellm"']
      statements:
        - aggregate_on_attributes("sum")
After three more requests the count read 8, the total since the pod started,
and sum(increase(gen_ai_usage_cost_USD_sum[24h])) matched LiteLLM’s own
spend total ($0.0034).
Issue 2: Every boot looks like an outage
Symptom
Flux and ExternalSecret failures only exist as Kubernetes events, which the
cluster collector already ships to VictoriaLogs. Three days of Warning events
showed a pattern: at 06:02 every morning, every ExternalSecret logged
UpdateFailed four times, and every HelmRepository Failed.
Cause
The lab boots at 06:00. For a minute, OpenBao is still unsealing and DNS is still settling, so the first sync attempts fail and the retries work. A rule on “any Warning event” would email me every morning. But some failures happen once and are real: a HelmRelease whose upgrade fails is not retried.
Fix
Two rules with different patience:
| Rule | Watches | Fires |
|---|---|---|
| Flux release or Job failed | InstallFailed, UpgradeFailed, HealthCheckFailed, BackoffLimitExceeded | at once |
| Flux source or secret sync failing | any Warning from sources and ExternalSecrets | only if events keep coming: a 15-minute window held for 20 minutes |
A one-minute burst at boot never stays true for 20 minutes. A real sync failure keeps retrying and does.
Issue 3: The alert email was in Sent
Symptom
“Why didn’t I get any alert email?” The rules had fired, and Grafana’s notifier showed every email delivered with no error.
Cause
Grafana sends through Gmail SMTP with my own account, to my own address. Gmail files a message you send to yourself under Sent, not the inbox. Every alert was there.
Fix
I kept the email and added a channel I actually see: a Telegram bot. Every alert now goes to Telegram and email; the Watchdog goes only to healthchecks.io. In Grafana’s routing tree, a matching child route stops the root receiver, so email needs its own route after Telegram:
routes:
  - receiver: healthchecks
    object_matchers: [["watchdog", "=", "true"]]
  - receiver: telegram
    object_matchers: [["alertname", "=~", ".+"]]
    continue: true
  - receiver: email
    object_matchers: [["alertname", "=~", ".+"]]
The quotes around = are needed: in YAML 1.1, a bare = is a type tag, and
the file failed to parse without them.
Issue 4: The heartbeat was “late” most of the time
Symptom
Minutes after the heartbeat went live, healthchecks.io showed the check as “late”, over and over, without ever going down.
Cause
The route repeated the Watchdog every 5 minutes, but Grafana also waits for its 1-minute group interval, so pings arrived about every 6 minutes. The check expects one after every 5-minute mark, and showed “late” for the three minutes in between.
Fix
repeat_interval: 1m. Pings now arrive every two minutes, and the check is
green apart from a minute or two after each mark.
Issue 5: Grafana Cloud had been dropping the built-in host alerts
Symptom
To add a Telegram contact point in Grafana Cloud, I listed its notification
policy first. The root receiver was grafana-default-email, whose address
was the placeholder <example@email.com>.
Cause
My own host rules named their contact point directly, so they worked. The Linux integration’s 24 built-in rules (CPU, load, memory, disk I/O saturation, network errors, filesystems, clock, systemd) don’t name one, so they fall through to the root policy, and for days that had been an address that doesn’t exist. None of them was firing when I checked, but none of them could have reached me.
Fix
A contact point homelab with email and Telegram, set as the root receiver,
and used by the host rules too. Then I deleted my own “host memory high”
rule, because the built-in one covers it.
Issue 6: My SMART query broke on its first evaluation
Symptom
An alert email:
alertname = DatasourceError
rulename = PVE disk errors growing
Error = failed to execute query [A]: execution: vector cannot contain metrics with the same labelset
Cause
The rule summed the growth of several SMART counters at once:
sum by (instance, device, model) (increase({__name__=~"smart_ata_(reallocated_sectors|pending_sectors|...)"}[1h]))
increase() drops the metric name. One disk reports several of those
counters, and without their names they had identical labels, which
Prometheus refuses. The rule could not evaluate, so it fired an error.
Fix
Copy the name into an ordinary label first, in a subquery:
sum by (instance, device, model) (
  increase(label_replace({__name__=~"smart_ata_(...)|smart_nvme_media_errors"},
    "metric", "$1", "__name__", "(.+)")[1h:5m]))
Smaller Things Found on the Way
- The memory rule earned its place on day one: Grafana at 93% of its limit and the Tailscale proxy for Headlamp at 94%. Both limits went up, and the next morning the cluster collector needed the same.
smartctl --scanreports the SATA SSDs asscsi, which returns no SMART data. They need-d sat.- A dying disk nobody uses: pve-03 has an old 1 TB laptop HDD with 43 pending sectors, outside the Proxmox volume group and from long ago. It can’t be removed, so the SMART script skips it by model.
- Grafana Cloud won’t accept a test alert through its API (400), and local Grafana’s old receiver test endpoint is gone; a real alert was the test both times.
Result
| Watches | Where | Rules | Reaches me through |
|---|---|---|---|
| Cluster, apps, data, GitOps, control plane | lab Grafana | 36 + Watchdog | Telegram and email |
| The lab being alive | healthchecks.io | 3 checks: Watchdog, OpenBao snapshot, k0s backup (Part 31) | email from outside |
| Proxmox hosts, SMART, NICs, LAN DNS | Grafana Cloud | 14 + 24 built-in | Telegram and email |
Every rule was evaluated against live data before merging, and the paths to Telegram, email and healthchecks.io were each tested with a real alert.
Lessons
- Alert on silence. With “no data is OK”, a dead pipeline looks like a healthy one. One watchdog rule per pipeline costs nothing.
- The watcher needs a watcher outside the house. An always-firing rule that pings an external check is the cheapest dead-man’s switch there is.
- Check that alerts arrive, not that they fire. Both “the email is in Sent” and “the root policy is a placeholder” had every rule working and no notification reaching me.
- Dropping labels is not the same as aggregating. If the source keeps a cumulative stream per label set, sum the streams after removing labels.
- Give boot noise a hold time, and real failures none. Measure what
your restarts look like before choosing
for:. - Run every query on live data before it becomes a rule, including the cases where it should return nothing.
Series
This post is part of Homelab Rebuild:
- Part 1: Upgrading Proxmox VE 8 to 9
- Part 2: Starting Over When the IaC Is Broken
- Part 3: When Tailscale Breaks Your Cilium Gateway
- Part 4: Living on the Tailnet
- Part 5: Secrets Without Secrets in Git
- Part 6: Certificates, DNS and a Private CA
- Part 7: Self-Hosted CI and Getting Back to IaC
- Part 8: Stateful Workloads on Unequal Hardware
- Part 9: Going Public Safely with Cloudflare Tunnel
- Part 10: When the Hypervisor Went Quiet
- Part 11: Hardening the Cluster in Five Layers
- Part 12: Observability with Coroot, and Losing pve-01
- Part 13: The Host That Kept Losing Power
- Part 14: Observability, Take Two with OpenTelemetry
- Part 15: Requests and Limits for Everything
- Part 16: Handing the Cluster to FluxCD
- Part 17: Making the Guardrails Earn Their Keep
- Part 18: When the API Server Outgrew Its VM
- Part 19: Logging In to OpenBao with Cloudflare Access and Google
- Part 20: Headlamp SSO, or Teaching kube-apiserver to Trust Cloudflare Access
- Part 21: pve-02 Loses Power, and Pi-hole Has Nowhere to Go
- Part 22: Turning Four Days of Fixes into AI Runbooks
- Part 23: microVM Sandboxes on Proxmox
- Part 24: Pi-hole Without a Home Host
- Part 25: It Was the Router
- Part 26: TLS on the Front, Plaintext Behind It
- Part 27: One Bad Power Adapter, Two Different Deaths
- Part 28: Observability, Take Three: Making It Worth Looking At
- Part 29: One Meter for Every Model, LiteLLM on Workers AI
- Part 30: Proxmox Joins the SSO, and a Plan Token Loses Admin
- Part 31: First Backups, Postgres, OpenBao and etcd to R2
- Part 32: Alerts That Reach Me, Even When the Lab Is Dead (this post)
- Part 33: The Firewall Held, the Tailnet Did Not
- Part 34: From Watching to Blocking, and a Record of Who Did What